Internet technology and search engine optimization changes continue to affect small businesses and the marketing methods they use. Google forced everyone to think seriously about their mobile website in April 2015 with #mobilegeddon, creating a surge in businesses that finally took mobile websites seriously.
I'm closing out this month with a comparison of website visitors between November 2015 and November 2014, to show you why Google is concentrating so heavily on promoting mobile usage.
The following data comes from my own measurements across retail jewelry websites. This data may not be applicable to any other industry.
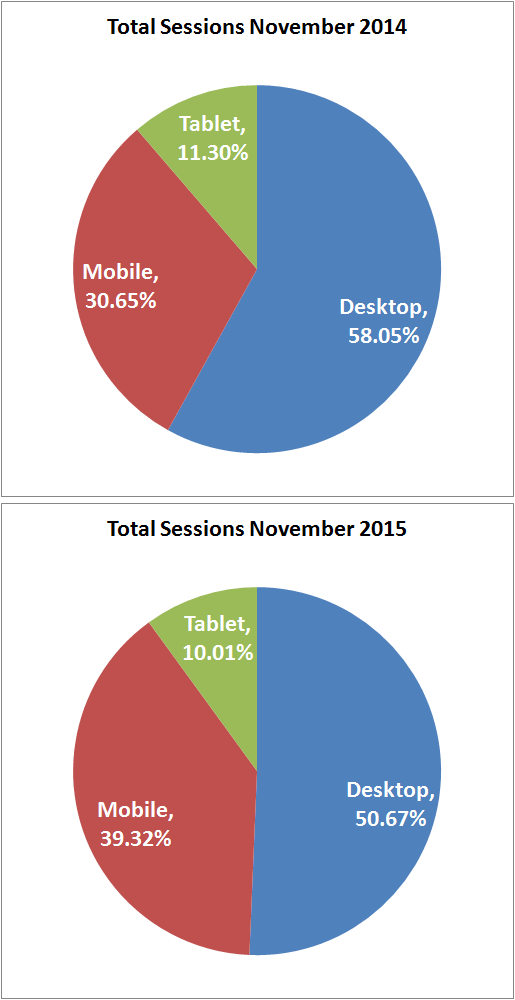
First, let's look at the comparison of total sessions between November 2014 and 2015:

Here's table format of those pie charts:
| Total Sessions | November 2015 | November 2014 |
| Desktop | 50.67% | 58.05% |
| Mobile | 39.32% | 30.65% |
| Tablet | 10.01% | 11.30% |
Since last year, there's been a 7.38% drop in desktop user sessions and a 1.29% drop in tablet sessions. That traffic hasn't been lost; the full 8.67% was funneled into mobile traffic. Some of the reports I've read over the last 12 months showed that desktop traffic had already dropped to below the 50% mark for many industries; that's why I specifically pointed out that this data comes from the jewelry industry.
From my point of view, the drop in tablet usage is simply because smartphone are getting larger. Fewer people need to use larger screen tablets when the smartphones are already too large to comfortably fit into a pocket.
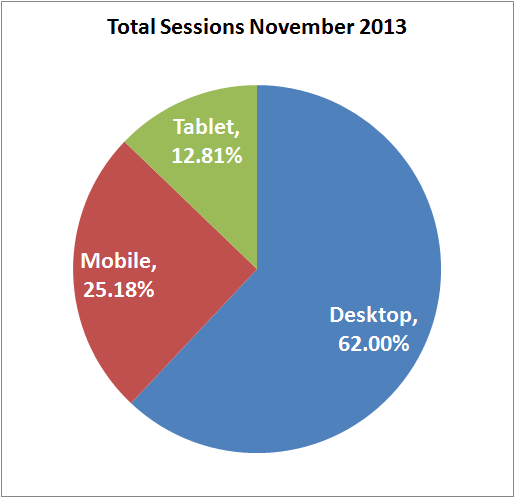
Where will we be another 12 months from now? The growing trend of mobile users isn't stopping any time soon. Here's another look at my old 2013 data:

Between November 2013 and November 2014 the desktop usage dropped 3.95%. That's about half of the drop from 2014 to today. I doubt we'll see a 14% drop in desktop usage by next year, but I do expect at least another 5% drop.
Some Thoughts
What does all this mean to you today and for this year's holiday season?
Since I started closely monitoring the mobile usage trends over the last 5 years, I've noticed that there's always a spike in mobile usage during the holiday season, but then usage quickly settles back down after December 31st. However, that spike is usually a hint of what the everyday average usage will be by the end of the following year.
About 50% of your audience is already viewing your cyber presence through a small, handheld digital window. Ask yourself if you took that into account already and keep these numbers in mind as you plan your future marketing.


