

In this edition of the Daily Golden Nugget, I'm going to show you how to read one of the most popular reports in Google Analytics. In my opinion, retail jewelry store owners should know the basics of how good or bad their website is doing, and what might make it better.
When you first log into your Google Analytics account, you will be brought to your Audience Overview page, so let's start there. Here's a snapshot of one of my accounts:
(click to view larger)
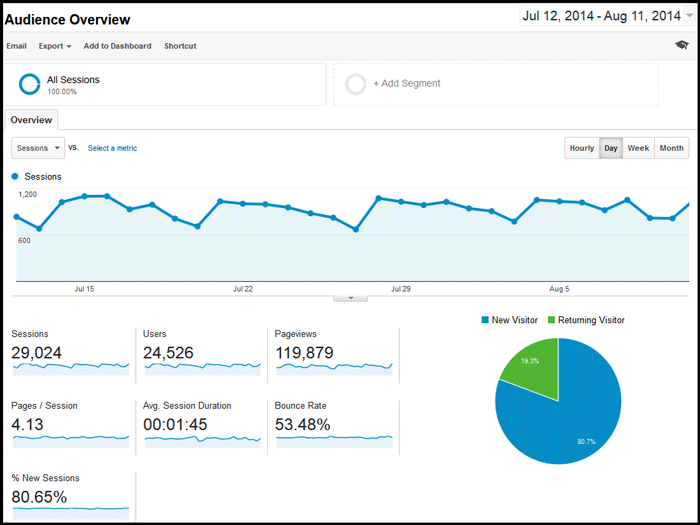
The above Audience Overview shows you the total number of "sessions" for the last 31 days. Every blue dot on the chart represents a day, and this shows the total sessions for each day.
Notice the 5 low points on the chart that I'm pointing out below; these are the past 5 Sundays.

Sunday always has the lowest traffic levels and I've found this to be normal across all retail jewelry websites. Also notice the rise in traffic on every Monday with a gradual decline in traffic every day of the week. These website traffic charts have always made me wonder how much business a retail jeweler loses by being closed on Monday, as so many are.
Google tracks how long people stay on your website and they count one session as the period of time someone clicks around your website. But they count another session if the person stops using your website for more than 30 minutes. All those people who stepped away from their desk to go to lunch, answer a phone call, or get a cup of coffee would have left their web browser alone for more than 30 minutes. The next time they return to your site they would trigger a new session.
Here's a closer view of the numbers shown at the bottom of the above image:

You see that 29,024 sessions were recorded in the last 30 days by 24,526 people. It's quite possible that 4,498 people (that's 29,024 minus 24,526) went to lunch before they were done browsing the site.
On average, every time a person visited this site (a single session), they looked at 4.13 pages. There are a few thousand pages on this site and it's very likely that many of those 4.13 pages were the same page, for example the home page. With a little math, multiplying 4.13 x 29,024 you get 119,869 total pages viewed in the last 31 days.
Notice how Google reports 119,879 "pageviews" even though the math works out to 119,869. This is due to common rounding errors in the way Google Analytics counts. This is not an exact science, so don't worry about it.
The Average Session Duration is the next number to explain. This is how long every person stayed on this particular website. The 1 minute 45 seconds is the average amount of time it takes people to click through and read those 4.13 pages. This session duration has the potential to fluctuate wildly because of promotions, photo galleries, and interesting blog posts that lure people to stay a little longer.
This same website had an average session duration of 7 minutes 53 seconds last year this time.
It's important for you to dig through your analytics to see what pages people are staying on, and try to figure out why they are staying. A quick review of this particular site shows that a lot more people were looking at the product catalog for a longer duration last year than they are this year.
Here's a random idea for you: Pay attention to how many people look at a single product and how long they are looking at it for. This might indicate a popular product that you can spotlight on your homepage or in a blog post. It also might be a good idea to reorder that item quickly after it sells.
The bounce rate for this site says 53.48%. The bounce rate is measured from the number of people who looked at a single page on your website then left. They might have clicked the browser's back button or closed their browser window. Your goal should be to get this number lower than 50%.
A lot of things could affect your bounce rate up and down, and it's important to know what is causing it to move in either direction. Your pay per click ads might cause the bounce rate to increase as people arrive on your landing page and realize your offer is not what they are looking for. A Facebook promotion or shared link could also increase the bounce rate because your FB fans are only interested in the single page you shared.
Although your blog pages might be successful at acquiring scads of new visitors to your site, those same blog pages will probably cause your bounce rate to skyrocket. The magic trick to a successful blog is to include some additional hook to further lure the visitor into your site. The easiest method of doing this is by including some other type of message or banner in the margin of the blog.
On a side note, the bounce rate of my jwag.biz blog used to be near 90%, but now it's about 35%. I modified my Google Analytics tracking code to include the "setTimeout" command for 50 seconds. This command allows me to track everyone who reads one of these posts for more than 50 seconds, and consider them a real visit rather than a bounce. This little technique is a little nerdy and you'll need to ask your programmer to figure it out for you.
On the other hand, that "setTimeout" command is probably only good to use on pure blogging sites and it's one of the black hat ways your jewelry SEO agency could artificially improve your website stats.
The last number reported above is the Percentage of New Sessions, which shows 80.65%. This refers to the number of computers that have never before visited your website. Notice that I said that the new sessions reports the computers that have never before been to your site, but this does not refer to people. I have 3 smartphones, 3 computers, and 2 tablets at my disposal and although I primarily use 1 of each, I might use any one of them to visit a site. The first time I use each of those devices it would count as a new session. I'm one person, but I could easily account for 8 different new sessions. Perhaps not everyone has so many devices as I do, but they could easily have 2 or 3, especially from work to home.
I've seen this "% New Sessions" number fluctuate wildly between 95% and 75% on different jewelry websites depending on the time of year and any online promotions. Those pay per click campaigns will make this number rise very high while your email marketing campaigns will make the number drop.
So which is better, a high or low percentage? It all depends. This number provides a quick glimpse into your overall online marketing activity. A lower number means you are having good success at getting your previous customers back to your site while higher numbers usually mean you lack a serious approach to customer engagement and social interaction.
Let me know if you liked this Google Analytics lesson and if I should continue some more lessons like this in the future.

